

Clothes To Kids proposal

THE
ONLY
THING
THAT
MATTERS
TO
US
&
OUR
CLIENTS
IS
ROI
Supplemental Video Notes
1,000+
Small-to-Medium Businesses Strategically Advised
600+
Successful Integrated
Marketing Campaigns
7.8X
ROI
Average Client
Return On Investment
300+
Websites Produced
(Developed & Designed)
1,000,000+
High Performing
Emails Deployed
CASE STUDY
Our Commercial Real Estate Client Saw 2020 As An Eventual Blessing - First Disguised As A Curse
The Covid ERA destroyed commercial real estate firms.
With every bad, there's a good. We used this time to re-strategize.
-
We entered The Lockdown with our newly signed client, a Florida-based commercial real estate company, NAME REDACTED, facing a dual challenge of low lead generation and limited brand awareness as it underwent a succession transition from a legacy owner to a new, young CEO. The company needed to revitalize its image and attract potential clients to increase business. Tocobaga initiated a rebranding campaign, focusing on a modern and dynamic image while respecting the company's legacy. We employed a mix of digital and traditional strategies, including a revamped website, selective PR strategies, networking event creations and participation in community efforts utilizing vacant properties to boost brand visibility.
-
We capitalized on the new allotment of time. Planned the next 5 years with SMART goals, benchmarks and KPIs. The company's website underwent a modern redesign to enhance user experience, incorporating a sleek design and showcasing successful case studies. Multiple channels were utilized to highlight the CEO's vision while paying respect to the previous owner's cowboy persona, researched industry insights, and the revamped the client's unique selling propositions. Participation in relevant industry events allowed our client to connect with potential clients and partners.
-
The strategic approach led to a significant uptick in lead generation and brand awareness, resulting in a remarkable 4.1x return on investment (ROI) in the post-Covid Era. The updated website attracted more visitors, and the CEO's active presence on social media contributed to a positive perception of the company. Tocobaga successfully positioned our client as a forward-thinking industry player, gaining trust and interest from potential clients. The successful case study underscores the importance of strategic rebranding and a multi-channel approach to lead generation. Balancing modernity with respect for legacy allowed our client to capture the attention of its target audience, ultimately leading to a substantial ROI and a strengthened market position.
CASE STUDY
Home Services Is Where The Heart Is
People get in routines because that is always how they have been doing it.
"People don't change" isn't our favorite phrase because...well...change is inevitable.
We had to use the big dog hot phrase, Change Management, to achieve our wins in Lead Gen, Sales Ops and Automations.
-
A 40 year old mom-and-pop home services company, NAME REDACTED, faced the challenge of expanding its client base and increasing revenue. Their biggest challenge was the larger, corporate level competition squeezing their market share. To achieve this, NAME REDACTED needed a comprehensive lead generation strategy that would leverage multiple channels and integrate seamlessly to maximize results.
-
Tocobaga implemented a multichannel approach, combining digital and traditional marketing channels. We utilized targeted online advertising, optimized their website for conversions, ran email campaigns, and engaged in local community outreach. The goal was to create a cohesive marketing ecosystem that guided potential clients through the customer journey. Track everything. We also had to clean up their entire CRM of over 40,000 contacts and develop an API to integrate with their field operating software. The company invested in targeted online advertising campaigns to reach a broader audience. Simultaneously, we revamped their website, ensuring it was user-friendly and featured compelling content. Email campaigns were personalized and segmented to nurture leads effectively.
-
The integrated approach proved highly successful, resulting in an outstanding 38.7x return on investment (ROI) in 6 months. The online advertising increased visibility, the optimized website improved conversion rates, and the personalized email campaigns fostered strong customer relationships. The community outreach efforts not only contributed to brand awareness but also generated local leads. We are proud of this well-executed, multichannel lead generation strategy. The seamless integration of online and offline efforts, combined with a focus on user experience and community engagement, led to an impressive ROI. This success emphasizes the importance of a holistic approach in achieving significant outcomes in the competitive home services industry.
CASE STUDY
Challenge Accepted
We typically don't do event marketing.
We saw this as a fun challenge to up our game.
-
In 2016, new, local altruistic organization wanted to partner with a national charity for a mixed used festival event. We faced the challenge of low attendance, little-to-no brand awareness outside of the organization's personal reach and limited funds for their upcoming fundraising event. They needed to boost lead generation to ensure a successful turnout and maximize donations.
-
We implemented a multi-channel marketing strategy, leveraging social media, email campaigns, and partnerships with local businesses. They also optimized their website for user engagement and introduced a referral program to encourage participants to invite others. We utilized the charity's compelling storytelling in their social media posts and emails, highlighting the impact of their cause. They engaged with influencers and community leaders to amplify their message. Additionally, they collaborated with local businesses to sponsor and promote the event.
-
The lead generation efforts exceeded expectations, resulting in an 8.4x return on investment (ROI) and sold out the event with 5,000 attendees. The optimized website attracted more visitors, and the referral program significantly expanded the reach. The event saw a substantial increase in attendance, leading to a successful fundraising outcome that surpassed the charity's initial goals. The success of the lead generation campaign emphasized the importance of a comprehensive, multi-channel approach. Engaging storytelling, influencer partnerships, and community involvement proved to be powerful tools in achieving remarkable ROI for the charity event. We created the marketing machine. This festival has now spawned off 5 additional metropolitan cities using our framework as their blueprint.
-

Steven Fantetti
Serial Entrepreneur, M&A Attorney
10x Client
Click Here To Email -
Nate Cinal
Owner & Operator of Tampa Bay’s Only Apple B2B Certified Managed Services Provider, SCOUT IT
Preferred Referral Partner
-

Dean Akers
“Leave the campsite better than you found it, and the world will be a better place because of it”
-
Standard Expense Allocation Benchmarks for U.S. Nonprofits
American charitable nonprofits organize their budgets into three primary functional expense categories mandated by IRS Form 990 reporting: program services, administrative (management and general), and fundraising expenses.* These categories provide the foundation for evaluating nonprofit financial efficiency and accountability.
Program Expense Ratios
For U.S. charitable organizations, the program expense ratio—measuring the percentage of total expenses devoted to mission-driven program activities—serves as the primary efficiency benchmark. Leading American charity evaluators recommend that nonprofits allocate 65-75% of total expenses to program services.†,‡
Charity Navigator, the nation's largest nonprofit evaluator assessing nearly 200,000 tax-exempt 501(c)(3) charities, updated its rating system in 2023 and now generally awards full credit to organizations whose program expenses constitute 70% or more of total expenses.§,¶ This represents a shift from their previous 75% threshold, reflecting updated understanding of operational realities.¶
The Better Business Bureau's Wise Giving Alliance, which evaluates nonprofit trustworthiness through its 20 BBB Standards for Charity Accountability, recommends a minimum program expense ratio of 65%.†,‡,#
CharityWatch, described as "America's most independent, assertive charity watchdog," considers a charity highly efficient when program spending reaches 75% or higher of total expenses.‡,††
Sector-Specific Program Expense Benchmarks
National benchmarks vary significantly by nonprofit sector, reflecting different operational models:§§
Education & Research: 80% program, 10% management, 10% fundraising
Health: 85% program, 7% management, 8% fundraising
Human Services: 75% program, 12% management, 13% fundraising
Arts & Culture: 70% program, 15% management, 15% fundraising
Environmental & Animal Welfare: 78% program, 12% management, 10% fundraising
A 2012 study analyzing U.S. nonprofit resource allocation patterns using IRS data found that when organizational budgets increase, average program ratios typically remain stable at prior-year levels. However, when budgets decrease, charities reduce program spending more rapidly than overhead, resulting in declining program ratios—demonstrating asymmetric resource allocation behavior.¶¶
Administrative Expense Guidelines
U.S. nonprofit watchdog organizations recommend that administrative costs—covering operations, salaries, office space, utilities, insurance, and technology infrastructure—should represent no more than 10-15% of total expenses.†,‡ The Better Business Bureau suggests that nonprofits spend less than 10% on executive compensation specifically.##
Research analyzing IRS Form 990 data from American nonprofits found that arts, culture, and humanities organizations typically maintain higher administrative expense ratios compared to other sectors, while health organizations demonstrated administrative ratios approximately 10.5% lower than arts organizations.†††
Fundraising Expense Standards
The Better Business Bureau's Wise Giving Alliance recommends that American nonprofits spend no more than 35% on combined fundraising and administrative expenses.†,‡ More specifically regarding fundraising efficiency:
Charity Navigator suggests that under 35% of contributions should be spent on fundraising activities.##
CharityWatch uses a "Cost to Raise $100" metric, with highly efficient organizations spending $25 or less to raise $100 in donations.††
CharityWatch considers both a Program % of 75% or greater and a Cost to Raise $100 of $25 or less as indicators of high efficiency.††
The Charities Review Council recommends that American nonprofits allocate at least 65% of funds to programs and no more than 35% to fundraising and administration combined.‡
Marketing and Communications Budget Allocation
Within the broader expense framework, American nonprofits should allocate 5-15% of their overall budget to marketing and communications.‡‡‡ This percentage typically varies inversely with organization size: smaller nonprofits closer to $1 million in annual revenue should allocate toward the higher end (approaching 15%), while organizations approaching $5 million can operate efficiently at 5-7%.‡‡‡
According to M+R Benchmarks 2025, which analyzed data from 216 American nonprofit organizations, digital advertising spending patterns reveal:○○○,*
Nonprofits reinvested $0.14 in digital advertising for every dollar of online revenue in 2024, representing an 11% increase in total advertising investment year-over-year.○○○
Across all advertising channels (digital and non-digital), 72% of spending was dedicated to direct fundraising, 25% to brand awareness and advocacy, and 10% to lead generation.*
Search advertising delivered the highest return on ad spend at $2.70 in revenue for every $1 spent.*
The M+R Benchmarks 2023 study, analyzing hundreds of U.S. nonprofits, found that organizations increased digital ad spending by 28% in 2022, with nonprofits spending an average of $0.11 on digital advertising for every dollar of online revenue.† Within this allocation:
56% was devoted to digital fundraising
26% to brand awareness
15% to lead generation†
Financial Context for $1-5 Million Organizations
Understanding the broader landscape is essential: according to the National Center for Charitable Statistics at the Urban Institute, 97% of U.S. nonprofits operate with budgets under $5 million annually, and 92% function with less than $1 million per year.‡ This means organizations in the $1-5 million revenue range represent the upper tier of small to mid-sized American nonprofits.
Data from Candid (formerly GuideStar Foundation), the authoritative source on U.S. nonprofit information managing IRS Business Master File data, indicates that American nonprofits collectively raise $3.7 trillion annually and spend $3.5 trillion.§
According to Giving USA 2025, the authoritative annual report on U.S. philanthropy published by the Indiana University Lilly Family School of Philanthropy, total charitable giving in the United States reached $592.50 billion in 2024, a 6.3% increase in current dollars (3.3% adjusted for inflation).¶ Individual giving comprised the largest share at $392.45 billion (66.2% of total giving), with foundations contributing $109.81 billion, bequests $45.84 billion, and corporations $44.40 billion.¶
IRS Reporting and Functional Expense Allocation
The Internal Revenue Service requires American 501(c)(3) charitable organizations with gross receipts of $200,000 or more or total assets of $500,000 or more to file the full Form 990 annually, which includes detailed functional expense reporting on Schedule H and other schedules.#,†† Organizations with lower thresholds may file Form 990-EZ or Form 990-N.#
The IRS Statistics of Income (SOI) Division produces comprehensive microdata files for all Forms 990, 990-EZ, and 990-PF returns filed by active organizations, representing the most authoritative source of U.S. nonprofit financial data.†† These publicly available datasets enable analysis of spending patterns across organization sizes and sectors.
Measuring Marketing ROI for American Nonprofits and Charities
Defining Marketing ROI for U.S. Charitable Organizations
American nonprofit marketing ROI measurement must account for both financial returns and social impact relative to marketing investments. The basic financial formula remains:
ROI = (Net Profit from Marketing – Marketing Investment) / Marketing Investment × 100
However, effective U.S. nonprofit measurement extends beyond monetary metrics to include increased awareness, volunteer engagement, policy influence, and mission advancement.§§
Key Metrics for American Nonprofit Marketing ROI
1. Donor Acquisition Cost (DAC)
Donor acquisition cost calculates the expense incurred to attract each new supporter:
DAC = Total Marketing and Fundraising Costs / Number of New Donors Acquired
Industry benchmarks from U.S. nonprofit data indicate that average acquisition costs range from $50-100 per donor, approximately 5 times more expensive than retaining existing donors ($10-20 per retention).¶¶ Event-based acquisition demonstrates higher costs ($70-100 per donor) but often yields supporters with greater lifetime value who continue giving for four or more years.¶¶
2. Digital Fundraising Performance Metrics
M+R Benchmarks 2025, analyzing American nonprofit digital performance, reports:○○○,##
Average online revenue for U.S. nonprofits increased 2% in 2024, following a 1% decline in 2023
Revenue from monthly giving increased 5% and accounted for 31% of all online revenue
For every 1,000 fundraising emails sent, U.S. nonprofits raised $58, marking a 10% decrease from 2023
Nonprofits raised an average of $0.13 through donor-advised funds for every dollar raised online, with DAF revenue increasing 6% in 2024
Email list growth for participating U.S. nonprofits showed a median net growth of 7%##
3. Return on Advertising Spend (ROAS) by Channel
M+R Benchmarks data on U.S. nonprofit advertising effectiveness reveals significant variation by platform:*,##
Search advertising: $2.70 per dollar spent (highest return)
Social media overall: Varies significantly by platform
Connected TV: 84% spending increase in 2024, representing 15% of fundraising advertising budgets
Linear TV: 77% of total non-digital ad spend
Among digital advertising specifically, search and social ads combined to represent 80% of total U.S. nonprofit digital ad spending.*
4. Channel-Specific Acquisition and Revenue
Analysis of American nonprofit fundraising reveals:##,†††
Email marketing: Generates 28% of total online revenue for U.S. nonprofits
Monthly giving programs: Account for 31% of all online revenue with median individual gift sizes lower than one-time donations but superior lifetime value
Direct mail: Declined 6% year-over-year in 2024, with nonprofits raising $0.94 through direct mail for every $1 raised online##
Text messaging: U.S. nonprofits raised $92 per 1,000 texts sent, $16 more than per 1,000 emails, though mobile accounts for only 0.37% of total online fundraising##
5. Conversion Rates and Device Performance
M+R Benchmarks 2024 data shows:##
Overall conversion rate on nonprofit donation pages: 12% (16% desktop, 10% mobile)
78% of online revenue came from desktop devices despite 52% of website traffic originating from mobile devices
Average gift on desktop: $137 versus $83 on mobile devices
Payment method adoption: 76% of U.S. nonprofits offer PayPal, 47% Apple Pay, 40% Google Pay
Attribution Methodologies for U.S. Nonprofit Marketing
Multi-touch attribution has become increasingly important for American nonprofits as donors interact across multiple channels before converting. Attribution models include:‡‡‡
First-Touch Attribution: Assigns 100% credit to the initial interaction. Useful for understanding awareness channels but overlooks nurturing touchpoints.
Last-Touch Attribution: Credits the final interaction before conversion. Identifies closing channels but ignores earlier influence.
Linear Attribution: Distributes credit equally across all touchpoints. Simple but may not reflect varying influence levels.
Time Decay Attribution: Gives more credit to interactions closer to conversion.
Multi-Touch Attribution (MTA): Tracks each marketing touchpoint in the donor journey, providing holistic understanding of channel interplay.‡‡‡
Data-Driven Attribution: Uses machine learning to analyze converting and non-converting paths, dynamically assigning credit based on actual contribution.‡‡‡
Measurement Tools and Systems
Customer Relationship Management (CRM) Platforms
Leading U.S. nonprofit CRM systems include DonorPerfect, Bloomerang, Keela, Salsa, and Blackbaud products, which integrate with matching gift automation tools like Double the Donation to identify match-eligible donors and trigger follow-up communications.*
Social Return on Investment (SROI)
SROI methodology, increasingly adopted by American nonprofits, quantifies social and economic value by assigning monetary values to social outcomes:†,‡
SROI = (Social Impact Value – Initial Investment Amount) / Initial Investment Amount × 100%
This framework enables nonprofits to demonstrate that, for example, every $1 invested in job training programs generates $2.50-$3.50 in social value through increased employment, reduced government assistance needs, and improved community outcomes.†
Current State of U.S. Nonprofit Financial Health
The Nonprofit Finance Fund's 2025 State of the Nonprofit Sector Survey, which surveyed U.S. nonprofit leaders from January through March 2025, reveals:§
36% of U.S. nonprofits ended 2024 with an operating deficit, the highest in 10 years of survey data
85% expect service demand to increase in 2025
86% reported that high costs due to inflation have impacted their organizations and clients
52% have 3 months or less cash on hand, with 18% having one month or less
84% of respondents with government funding expect cuts to that funding
57% were able to fully meet service demand in 2024, with only 48% anticipating they can meet demand in 2025§
These findings underscore the importance of efficient resource allocation and effective marketing ROI measurement for American charitable organizations in the $1-5 million revenue range.
Best Practices for $1-5M American Nonprofits
Organizations in this revenue tier should:
Maintain program expense ratios of 65-75% to meet donor and watchdog expectations while preserving operational capacity†,‡,§§
Allocate 5-15% of budget to marketing (trending toward 10-12% for organizations in the $2-3M range)‡‡‡
Track essential metrics including:
Donor acquisition cost (target: $50-100 per donor)¶¶
Cost per dollar raised (target: under $0.35)††,##
Return on ad spend by channel (benchmark: search at $2.70 per $1 spent)*
Donor retention rates and lifetime value
Implement measurement infrastructure:
Nonprofit CRM system integrated with donation platforms
Google Analytics or similar for website tracking
UTM parameters and unique tracking codes for all campaigns
Monthly metric review cadence
Balance financial and impact ROI: Report marketing effectiveness using multiple lenses including financial ROI, acquisition efficiency, mission outcomes achieved, and social return on investment for major programs.†,‡
footnotes
* Araize, "Chart of Accounts for Nonprofits: Guide To Proper Setup," August 27, 2025,
https://araize.com/chart-of-accounts-for-nonprofits/
.
† Warren Averett, "Nonprofit Ratios: How to Use Them and What They Measure," June 19, 2024,
https://warrenaverett.com/insights/nonprofit-ratios/
.
‡ Syracuse University, "Big Nonprofit Spending: Where the Dollars Go," November 29, 2022,
https://onlinegrad.syracuse.edu/blog/big-nonprofit-spending/
.
§ Charity Navigator, "Accountability & Finance," May 3, 2022,
https://www.charitynavigator.org/discover-charities/where-to-give/accountability-finance/
.
¶ Charity Navigator, "What is Overhead? And Should Donors View It Differently?," July 17, 2024,
https://www.charitynavigator.org/articles/what-is-overhead/
.
# Beyond the Numbers: Understanding Nonprofit Ratings & Their Impact, June 9, 2025,
https://pro.gofundme.com/c/blog/nonprofit-ratings
.
†† CharityWatch, "Our Charity Rating Process," accessed November 14, 2025,
https://www.charitywatch.org/our-charity-rating-process
.
§§ PBMares, "Program Expense Ratio Nonprofits | Health Benchmarks," March 11, 202
5,
https://pbmares.com/nonprofit-program-expense-ratio/
.
¶¶ Publications of the American Accounting Association, "Nonprofit Resource Allocation Decisions: A Study of Marginal versus Average Spending Patterns," June 30, 2012,
https://publications.aaahq.org/ajpt/article-abstract/31/2/1/3215/
.
## BoardEffect, "What percentage of a nonprofit budget should be for fundraising?," May 4, 2024,
https://www.boardeffect.com/blog/percentage-nonprofit-budget-fundraising/
.
††† PMC, "Funds allocation in NPOs: the role of administrative cost ratios," December 26, 2017,
https://pmc.ncbi.nlm.nih.gov/articles/PMC5735212/
.
‡‡‡ Big Sea, "Top 5 Priorities for a Small Nonprofit Marketing Budget," September 3, 2025,
https://bigsea.co/insights/top-5-priorities-for-a-small-nonprofit-marketing-budget/
.
○○○ M+R Benchmarks, "Key Findings | M+R Benchmarks 2025," December 31, 2023,
https://mrbenchmarks.com/key-findings/
.
(continuing with additional symbols cycling through the pattern) NonProfit PRO, "5 Takeaways From M+R's Online Fundraising 'Benchmarks'," August 4, 2025,
https://www.nonprofitpro.com/article/5-takeaways-from-mrs-online-fundraising-benchmarks/
.
NLCTB, "4 Important Insights from the 2023 M+R Benchmarks Study," accessed November 14, 2025,
https://nlctb.org/4-important-insights-from-the-2023-mr-benchmarks-study/
.
Nonprofit Impact Matters, "Downloadable Charts & Figures," accessed November 14, 2025,
https://nonprofitimpactmatters.org/downloadable-charts-figures/
.
Candid, "Money in the U.S. social sector | Key facts and figures," March 13, 2025,
.
Giving USA, "Giving USA 2025: U.S. charitable giving grew to $592.50 billion in 2024, lifted by stock market gains," June 23, 2025,
https://givingusa.org/giving-usa-2025/
.
Urban Institute, "Data on Nonprofits' Government Funding Have Four Main Limitations," October 1, 2025,
.
IRS, "SOI Tax Stats - Charitable and exempt organizations statistics," November 8, 2016,
https://www.irs.gov/statistics/soi-tax-stats-charitable-and-exempt-organizations-statistics
.
NPO Info, "Top Metrics for Measuring Nonprofit Marketing Success," May 21, 2024,
https://npoinfo.com/2024/05/21/top-metrics-for-measuring-nonprofit-marketing-success/
.
Keela, "The Ultimate Guide to Donor Acquisition: Grow Your Nonprofit's Supporter Base," March 6, 2025,
https://keela.co/blog/donor-acquisition/
.
M+R Benchmarks 2025, full report data accessed November 14, 2025,
.
NPTech for Good, "2025 Online Fundraising Statistics for Nonprofits," October 11, 2025,
https://nptechforgood.com/2025/10/11/2025-online-fundraising-statistics-for-nonprofits/
.
Reef Digital, "Multi-Touch Attribution and Marketing Mix Modelling for Nonprofits," October 2, 2024,
https://reefdigital.com.au/multi-touch-attribution-marketing-mix-modelling-for-nonprofits/
.
Double the Donation, "22 Top Nonprofit CRMs to Better Manage Supporters in 2025," July 31, 2025,
https://doublethedonation.com/nonprofit-crm/
.
Social Impact Architects, "Social Return on Investment | Nonprofit Impact Measurement," March 3, 2025,
https://socialimpactarchitects.com/social-return-on-investment/
.
Blog Upmetrics, "Social Return on Investment (SROI): Measuring the Intangible," April 10, 2025,
https://blog.upmetrics.com/social-return-on-investment/
.
Nonprofit Finance Fund, "Nonprofit Finance Fund 2025 State of the Nonprofit Sector Survey," 2025,
https://nff.org/state-of-the-sector-survey
.
Clothes To Kids 6-Month Marketing Strategy Proposal
1. Context and Analysis
1.1 Insights from the Tocobaga × Clothes To Kids meeting
Nov 7’s meeting summary shows that Law Smith (Tocobaga) met with Jennifer J and Sarah S from Clothes To Kids (CTK) to discuss the non-profit’s digital marketing and website performance. CTK’s goal is to provide approximately 16,000 wardrobes to children in 2025 and to grow to approximately 25,000 wardrobes by 2030. Law noted that the current website is not generating donations effectively and suggested immediate improvements such as integrated donation forms, better storytelling, consistent content, and SEO. Jennifer highlighted that CTK uses multiple platforms to collect donations and volunteers and wants these experiences unified. They agreed to schedule an in-person strategy session to clarify goals and to better leverage the website and digital presence.
Action items:
- Update the website to clearly highlight the different ways to support CTK (donate, volunteer, shop, etc.).
- Schedule an in-person strategy session to discuss goals and how to best leverage the website and digital presence.
- Embed donation and volunteer sign-up functionality directly in the site instead of sending visitors to third-party forms.
- Create an archive for past media content (blog posts, news stories) to drive traffic and engagement.
Identified needs: The meeting highlighted that the CTK website is not attracting donors effectively; the organization must better communicate growth goals, provide guidance on telling its story, integrate donation and volunteer platforms into the site, and organize content for visitors.
1.2 Financial analysis (FY 2024)
Revenue and support. CTK’s audited 2024 financial statements show that the organization generated $2.845 million in total support and revenue (including grants and contributions, in-kind donations, special events, and investment income). Contributions and grants accounted for $1.47 million, in-kind donations contributed $0.81 million, and special event revenue added $0.41 million.
Expenses. CTK spent $2.21 million in FY 2024. Program expenses were $1.92 million, management and general expenses $119k, and fundraising and development $167k. Under the statement of functional expenses, marketing and printing totalled $18,388 in 2024 (compared with $18,399 in 2023), of which about $1,419 was charged to program services, $425 to management and general, and $16,544 to fundraising. That means CTK spent approximately 0.6% of its FY 2024 revenues on marketing and printing ($18,388 ÷ $2,845,168). The marketing budget is therefore well below typical nonprofit benchmarks (see below).
Net assets. After expenses, CTK recorded a change in net assets of +$0.64 million and ended FY 2024 with $3.17 million in net assets, providing a solid financial base for growth.
1.3 Benchmarks for nonprofit marketing spending
Multiple industry studies recommend that nonprofits dedicate 5–15% of their total budget to marketing. Big Sea, a digital agency that works with nonprofits, notes that nonprofits should spend between 5% and 15% of their overall budget on marketing and that smaller organizations may need to be nearer to 15% to have meaningful impact. WebFX, another digital-marketing agency, echoes this advice, recommending that nonprofits allocate 5–15% of total revenue to marketing and reserve 5–10% of the marketing budget for testing new strategies. Getting Attention’s nonprofit budgeting guide reiterates that nonprofits should allocate between 5% and 15% of their budget to marketing, contrasting this with the for-profit range of 10–20%. It also cites the 2023 M+R Benchmarks Study, which found that nonprofits spent $0.11 on digital advertising for every dollar of online revenue, with 56% of digital advertising budgets devoted to fundraising, 26% to brand awareness, and 15% to lead generation.
In a large sample of 7,171 U.S. 501(c)(3) organizations (annual revenue $1–10 million), 60% of nonprofits reported advertising and promotion expenses and the median annual spend was $12,067. Performing-arts organizations spent the most (median $53,416) because their missions depend on audience attendance. Although CTK’s mission is not audience-dependent, its FY 2024 marketing spend ($18,388) is still low relative to its revenue base.
Implication for CTK: At $18,388, CTK’s marketing and printing budget is approximately 0.6% of total revenue, significantly below the 5–15% guideline. To grow from 16,000 wardrobes per year to 25,000 by 2030 and to attract more donors and volunteers, CTK needs a more proactive, story-driven marketing program and should invest a larger share of its budget in marketing activities.
2. Proposed 6-Month Marketing Commitment
2.1 Objectives and SMART goals
Based on the meeting insights and financial analysis, the following objectives are proposed for a six-month marketing commitment beginning 15 November 2025 and running through 15 May 2026. Each objective is accompanied by specific, measurable, achievable, relevant, and time-bound (SMART) goals.
| Objective | SMART goal | Rationale |
|---|---|---|
| Increase donations | Increase online donations by 20% compared with the same period in the previous year, achieving at least 250 new online donors and 50 new monthly recurring donors by 31 May 2026. | CTK’s growth requires additional funding; the website currently underperforms. Integrating donation forms and highlighting giving options should increase conversions. |
| Grow volunteer base | Recruit 180 new volunteer sign-ups (approximately 30 per month) via the website by 31 May 2026; achieve a 30% conversion rate from website visits to volunteer sign-ups. | Volunteers support store operations and related activities. Integrating volunteer sign-up forms and promoting opportunities will help meet store staffing needs. |
| Enhance brand awareness & community engagement | Increase overall website sessions by 30% and email list subscribers by 25%; achieve 10% growth in social media followers and 15% growth in engagement across Facebook and Instagram. | CTK’s mission relies on community recognition. Story-driven content, SEO, email, and social media will build awareness and engagement. |
| Improve digital infrastructure & analytics | Fully integrate donation and volunteer forms into the website (no third-party redirects), implement Google Analytics 4 and Tag Manager with conversion tracking, and establish a reporting dashboard with monthly reviews. | Without integrated forms and data, CTK cannot measure ROI. A digital foundation is necessary for sustainable growth. |
| Prepare for long-term growth | Document marketing processes, train CTK staff on website and content management plus digital tools, and develop a rolling content calendar for the next 6 months. | CTK staff need autonomy after the initial commitment. Training and documentation ensure continuity beyond the engagement. |
2.2 Target audiences and messaging
CTK serves multiple stakeholder groups. Messages should be tailored to the motivations of each audience.
| Audience | Characteristics & motivations | Messaging approach |
|---|---|---|
| Individual donors (major donors, recurring donors, one-time donors) | Adults in the Tampa Bay area and beyond who want to help children in need. They value impact, transparency, and local stories. | Use emotionally resonant storytelling about the children CTK serves; highlight that $75 provides a full wardrobe. Emphasize tax-deductible giving and options for one-time and recurring donations. Provide social proof (testimonials, impact metrics). |
| Corporate & foundation partners | Businesses and grant-making entities seeking to support community causes and meet CSR objectives. | Develop sponsorship packages with recognition benefits; emphasize CTK’s measurable outcomes and opportunities for employee volunteerism. Provide data (wardrobes provided, families served) and community impact stories. |
| Volunteers | Individuals (parents, retirees, students, corporate teams) motivated by hands-on service. | Promote fulfilling experiences of helping children, flexible shifts, and the joy of seeing kids pick new clothes. Simplify sign-ups and provide orientation resources. |
| Shoppers (customers of CTK thrift stores) | Members of the community who support CTK by shopping. | Advertise store promotions, “shop for a cause” messaging, and highlight that purchases fund wardrobes. Use social media and local SEO to drive foot traffic. |
| Schools & referral partners | Guidance counselors and social workers who refer families. | Provide clear referral guidelines and up-to-date information on eligibility; share success stories to encourage referrals. |
| General public & media | Residents of the Tampa Bay area unfamiliar with CTK’s work; local media outlets. | Use PR and community outreach to highlight CTK’s mission, milestones (for example, 16,000 wardrobes), and ways to support the organization. |
2.3 Overall marketing strategy
2.3.1 Website & digital infrastructure
Website audit and restructure. Conduct a full audit of the current site (UX, SEO, analytics). Reorganize navigation to feature “Donate,” “Volunteer,” “Shop,” and “Refer a Student” prominently. Create landing pages for each pathway with integrated forms rather than third-party links. Ensure mobile responsiveness and ADA compliance. Implement Google Analytics 4 and Tag Manager with conversion tracking.
Integrated donation & volunteer forms. Evaluate platforms such as Classy, Givebutter, or Funraise and embed secure forms directly on CTK’s domain. Provide options for one-time and recurring gifts, corporate matching, and volunteer scheduling.
SEO & content optimization. Perform keyword research targeting phrases such as “donate clothes Tampa,” “volunteer clothing nonprofit,” and “free clothes for kids.” Optimize titles, meta descriptions, headers, and alt tags. Implement schema markup for nonprofit and local business. Set up local listings (Google Business Profile) for each store.
Analytics and dashboards. Configure Google Analytics 4, Tag Manager, and Data Studio dashboards to track traffic sources, conversions (donation, volunteer sign-up, email sign-up), and revenue by channel. Review metrics weekly and share monthly reports with CTK leadership.
2.3.2 Content marketing & storytelling
Editorial calendar. Develop a six-month content calendar featuring weekly blog posts (stories of kids served, volunteer spotlights, donor recognitions, behind-the-scenes pieces) and monthly impact reports. Archive past media and blog content in a searchable section to drive organic traffic and provide social proof.
Email marketing. Set up an email platform (for example, Mailchimp or HubSpot) and segment the list by donors, volunteers, and shoppers. Launch a welcome series explaining CTK’s mission; send monthly newsletters with stories, opportunities to give, and volunteer needs. Use automation for donor thank-you messages and volunteer reminders.
Social media. Create a social media calendar with two to three posts per week across Facebook, Instagram, and LinkedIn. Share stories, behind-the-scenes videos, volunteer testimonials, and clear calls to action. Use Facebook and Instagram fundraising tools for specific campaigns. Monitor engagement and respond promptly.
Press and community outreach. Draft press releases announcing milestones (for example, number of wardrobes provided) and partnerships. Pitch human-interest stories to local newspapers, TV, and radio outlets. Participate in community touchpoints (for example, school fairs, chamber meetings) to raise awareness and recruit supporters.
2.3.3 Digital advertising & outreach
Google Ad Grants. Apply for Google Ad Grants (provides up to $10,000 in free search-ads credit per month). Once approved, create search campaigns targeting donation, volunteer, and shopping keywords. Allocate at least 70% of the budget to fundraising keywords, 20% to volunteering, and 10% to brand awareness. Optimize campaigns weekly.
Paid social advertising. Allocate a modest budget (for example, $1,000–$2,000 over six months) for Facebook and Instagram ads to reach prospective donors and volunteers in the Tampa Bay area. Use lookalike audiences based on existing donors and website visitors. Rotate creative every 2–4 weeks.
Retargeting. Implement retargeting via Google and Facebook to re-engage visitors who viewed donation or volunteer pages but did not convert.
2.4 Client services and communication
Kickoff and discovery. Conducted in the first week after project start. Since the engagement begins on 15 November 2025, kickoff will occur between 15–20 November 2025. This meeting will refine goals and gather materials.
Weekly check-ins. For the first month (15 November – 14 December 2025), hold 15–20 minute weekly meetings to review progress, identify blockers, and adjust tactics. Meetings will be virtual unless an in-person session is required.
Bi-weekly check-ins. Beginning in Month 2 (starting 15 December 2025), move to bi-weekly meetings (every other week) while continuing to provide weekly written updates via email. Meeting frequency can be adjusted if major campaigns or issues arise.
Responsive communication. The marketing consultant will respond to Clothes To Kids communications within one business day. A shared Slack channel or project management chat can be established for quick questions.
3. Conclusion
CTK’s mission of providing wardrobes to low-income children is life-changing, yet the current digital infrastructure and marketing spend are insufficient relative to industry benchmarks. CTK currently spends less than 1% of its budget on marketing and printing, far below the recommended 5–15% range. The six-month marketing commitment outlined above will modernize CTK’s digital presence, integrate donation and volunteer processes, tell compelling stories, and expand outreach through SEO, email, social media, and advertising. By investing in a structured, data-driven marketing program, CTK can unlock new funding streams, recruit more volunteers, and build the foundation needed to reach its goal of serving 25,000 wardrobes by 2030.
Prepared by: Tocobaga Integrated Marketing & Business Advisory
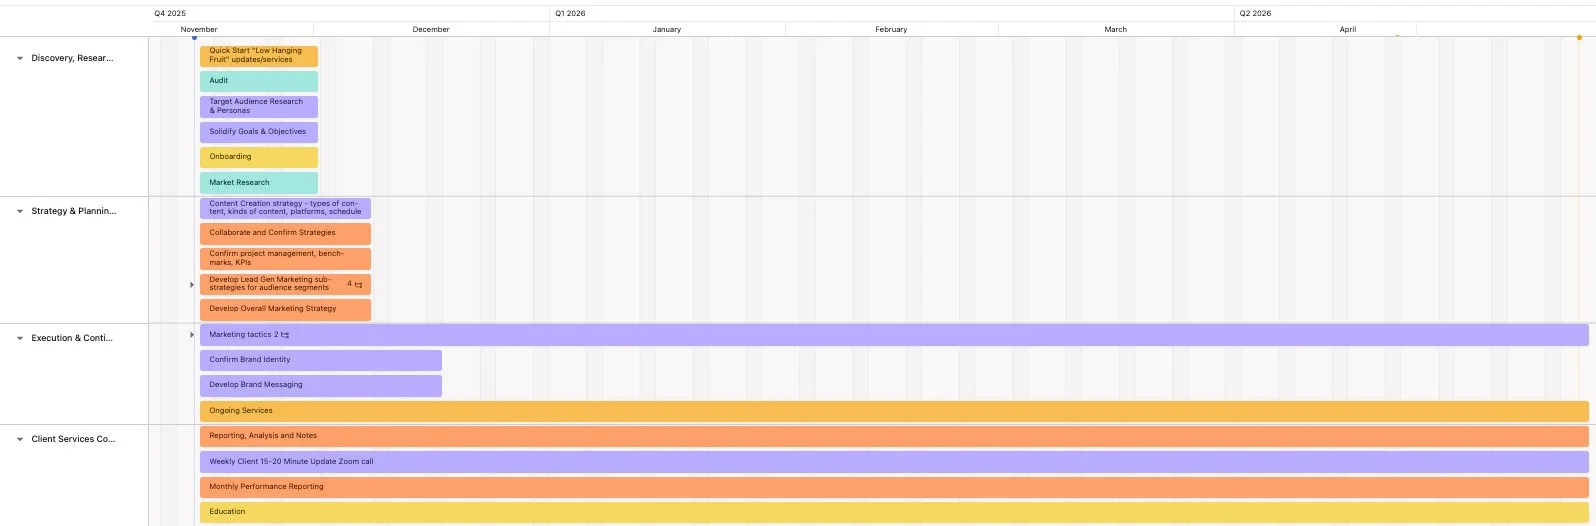
6 Month Simple Gantt Chart
Proposal Summary
Comparisons & Your Price
No one wants to feel like a dumbo overpaying an outside firm.
We get it. We abhor 99% of advisors and agencies. Our industry has a lot of snake oil.
If you’re going to try to compare bid costs, you must examine the exact same
QCD+F: Quality, Cost, Deliverability + Flexibility
Average Agency Rate
$6,127
Tocobaga’s Normal Rate
$3434+
Your Tocobaga Rate
$2,497
Promised in our meeting: We will waive any Early Termination clauses on our agreement if we can get started today Friday, Nov 14th/tomorrow Saturday, Nov 15th. You can terminate our working relationship at any moment.
DISCOUNT
SHOT
CLOCK
Quick-Start Next Steps
Administrative & Clerical Tasks
Invoice is deposited - either total for the month or deposit.
Tocobaga begins working
Tocobaga receives access to Tech Stack and any relevant brand collateral
Quick-Start onboarding will not be sequential - aka might be a little out of order than our normal process
Tocobaga will send over Company Services Agreement
Tocobaga will start a Slack workspace for internal communication. If you use another internal communication app, we can integrate Slack with other apps e.g. Slack two-way sync with Teams.
Tocobaga will coordinate a recurring, update meeting cadence - usually once a week initially and then every 2 weeks once we build a rhythm. If clients cannot attend because of schedule conflicts, we will record an update video and send via Slack.
If we’re ready to go right now,
the button to the invoice is below
or click on the invoice image to the right.
Once the invoice is paid, we begin.

Let’s Go ➳
ABOUT
TOCOBAGA
a
B2B, B2C SMB Strategic Advisory
&
Omni-channel, Integrated Marketing Agency
Fractional CMO FAQs
-
A Fractional CMO (Chief Marketing Officer) is a part-time or shared resource hired by a company to provide strategic marketing leadership. This arrangement allows businesses to access high-level marketing expertise without the cost of a full-time executive.
-
A Fractional CMO typically handles various aspects of marketing strategy, planning, and execution. Their responsibilities may include market analysis, brand development, campaign management, and team leadership. They work on a part-time basis, providing strategic guidance to help businesses achieve their marketing goals.
-
1. Cost-Effective: Fractional CMOs offer high-level expertise without the full cost of a permanent executive, making it a cost-effective solution for businesses.
2. Flexibility: Companies can scale their marketing leadership up or down based on their needs, without the commitment of a full-time hire.
3. Diverse Experience: Fractional CMOs often bring diverse industry experience, providing fresh perspectives and insights to the marketing strategy.
4. Strategic Guidance: These professionals offer strategic guidance, helping businesses align marketing efforts with overall business objectives.
5. Access to Networks: Fractional CMOs may bring valuable industry connections and networks, enhancing opportunities for partnerships and collaborations.
6. Objective Perspective: Being external to the organization, Fractional CMOs can provide unbiased and objective viewpoints on marketing strategies.
7. Quick Onboarding: As seasoned professionals, Fractional CMOs can quickly adapt to the business environment, accelerating the onboarding process.
8. Task-Specific Expertise: Companies can engage Fractional CMOs for specific projects or challenges, tapping into their expertise for targeted improvements.
9. Risk Mitigation: Businesses can mitigate the risk associated with hiring a full-time CMO by testing the waters with a fractional arrangement.
10. Efficiency: With a focus on strategic planning, Fractional CMOs can optimize marketing processes for efficiency and effectiveness.
Why would a SMB hire a Fractional CMO?
Small and Medium-sized Businesses (SMBs) might choose to hire a Fractional CMO for several reasons:
1. Cost Efficiency: SMBs often have budget constraints, and a Fractional CMO allows them to access high-level marketing expertise without the cost of a full-time executive.
2. Flexibility: The variable nature of marketing needs in SMBs can be addressed with a part-time resource, adjusting the level of expertise based on the business's current requirements.
3. Strategic Insight: Fractional CMOs bring strategic thinking and experience, helping SMBs develop effective marketing strategies aligned with their business goals.
4. Resource Optimization: SMBs may not need a full-time CMO, making a fractional arrangement a practical way to optimize resources and focus on key priorities.
5. Quick Impact: Fractional CMOs can swiftly assess the marketing landscape, identify opportunities, and implement strategies to generate quick and impactful results.
6. Access to Networks: SMBs can leverage the networks and industry connections of Fractional CMOs, opening doors to potential partnerships and collaborations.
7. Task-Specific Projects: SMBs can engage a Fractional CMO for specific projects or campaigns, tailoring the arrangement to address immediate marketing needs.
8. Objective Perspective: An external CMO can provide an unbiased and objective viewpoint, offering insights that might be challenging to achieve with an in-house team.
9. Risk Mitigation: Hiring a full-time executive involves risks, but a fractional arrangement allows SMBs to test the waters and evaluate the impact of senior marketing leadership.
10. Learning Opportunity: SMBs can benefit from the knowledge transfer that occurs when working with an experienced Fractional CMO, helping build internal marketing capabilities over time.
-
short answer: engagement, commitment, and scope of responsibility
more detailed answer:
1. Time Commitment:
- Fractional CMO: Works on a part-time or project-specific basis, dedicating a limited number of hours per week or month to the organization.
- Full-time CMO: Is a permanent, full-time employee committed to the organization on a daily basis.
2. Cost Structure:
- Fractional CMO: Typically charges on an hourly or project basis, providing a more cost-effective solution for businesses with budget constraints.
- Full-time CMO: Involves a fixed annual salary, potentially with additional benefits, which may be a higher financial commitment for the organization.
3. Scope of Responsibilities:
- Fractional CMO: Focuses on specific strategic initiatives, projects, or areas of expertise as agreed upon with the organization.
- Full-time CMO: Assumes a broader range of responsibilities, overseeing the entire marketing department and contributing to overall business strategy.
4. Flexibility:
- Fractional CMO: Offers greater flexibility, allowing organizations to scale up or down based on their evolving marketing needs.
- Full-time CMO: Represents a more fixed and consistent presence within the organization, which may be less adaptable to changes in workload.
5. Depth of Involvement:
- Fractional CMO: Often works at a more hands-on level, directly involved in strategy development and execution.
- Full-time CMO: Balances strategic leadership with managerial responsibilities, overseeing day-to-day operations and team management.
6. Long-Term Commitment:
- Fractional CMO: May be engaged for specific projects, a defined period, or on an ongoing but part-time basis, providing a more flexible arrangement.
- Full-time CMO: Implies a longer-term commitment to the organization, with a focus on sustained leadership and relationship building.
-
short-answer: adaptability, agility, resources, communication, wisdom (experience x knowledge)
long answer:
1. Diverse Perspectives: A Fractional CMO with varied industry experience can offer diverse perspectives and insights, bringing a fresh and innovative approach to marketing strategies.
2. Cross-Industry Best Practices: They can bring best practices from different industries, adapting successful strategies and tactics to the specific needs of the organization.
3. Benchmarking Opportunities: With exposure to various industries, a Fractional CMO can provide valuable benchmarking data, helping the organization understand how its marketing performance compares to similar businesses in different sectors.
4. Adaptability: The ability to adapt strategies from one industry to another can be a key advantage. The Fractional CMO can leverage successful techniques across different markets, promoting adaptability and agility.
5. Network Access: Their extensive network across industries can open doors to potential partnerships, collaborations, and industry-specific opportunities that may not be readily apparent within a single-sector focus.
6. Innovation and Creativity: Exposure to diverse industries fosters innovation and creativity. A Fractional CMO can bring a rich mix of ideas, drawing on experiences beyond the confines of a single sector.
7. Risk Mitigation: They can provide insights into potential risks and challenges by drawing on experiences from various sectors, helping the organization proactively address issues before they become significant problems.
8. Market Trends Awareness: A Fractional CMO engaged with multiple clients in different industries stays attuned to a wide range of market trends. This knowledge can be invaluable in staying ahead of industry changes and emerging opportunities.
9. Customization for Unique Markets: Leveraging experience in various industries, the Fractional CMO can tailor marketing strategies to suit the unique characteristics and challenges of the organization's specific market.
10. Continuous Learning: A Fractional CMO involved in diverse industries is likely to be a continuous learner, staying updated on the latest trends, technologies, and strategies across various sectors, which can benefit the organization.
-
1. Fractional CMO:
- A Fractional CMO typically refers to a part-time or shared Chief Marketing Officer who provides strategic marketing leadership to organizations on a flexible basis.
- They might work with multiple clients simultaneously, dedicating a certain number of hours per week or month to each client.
2. Interim Fractional CMO:
- An "Interim Fractional CMO" could imply a temporary or transitional role where the Fractional CMO is specifically engaged to fill a gap or address a short-term need.
- The "Interim" aspect suggests a focus on providing leadership during a transitional period, such as when a company is between full-time CMOs or undergoing significant changes in its marketing strategy.
SERVICES
-
OVERALL STRATEGY
CAMPAIGN STRATEGIES
TACITICAL STRATEGIES
-
SMART Goals, Benchmarks + KPI Planning
-
- Audiences
- Targets
- Find out 4 Holy Metrics:
- Cost Per Lead
- Cost Per Acquisition
- Average Revenue of a customer within 1st year
- Lifetime Value
Quick Start Services
Marketing Execution Services
-
Monitoring & Maitenance
Analytics Tracking
SEO (technical)
Live Chat optimization
Build out
* Landing pages by service
* Landing pages by service and city/region
Content
FAQs
Blog posts
-
- PPC
- Google Search Ads
- Bing Search Ads
- Local Services Ads
- AdRoll - cross platform retargeting/remarketing
- Later - platform-industry specific ads w/ Angi, Yelp, etc.
- Social Ads
- AdRoll retargeting ads on FB and IG
- Pinterest might be a great avenue
- Programmatic
- We can get precise targeting
-
- Technical SEO
- At least 1 blog post per month
-
- Automation emails for servicing
- Marketing email campaigns
- New lead automated journeys
-
- Review Capturing
- Review Monitoring
- Directory Listings optimization
-
Traditional Advertising - radio, tv, newspaper, magazine, etc.
Community - sponsorships, focused local corporate responsibility
-
BRANDING:
Brand Development
Brand Identities
Brand Messaging
DESIGN: Any design deliverables needed
Graphic Design, Website Design, UI (User Interface), UX (User Experience), Print Design, Online Ad Design, Video Editing, Image Editing, Custom Illustrations, Newspaper Ads and Design, Magazine Ads and Design, Brick & Mortar Exterior Signage, etc.
Support Services
-
create a Google Data Studio or similar to aggregate analytics into
1) Snapshot
2) by campaign/tactic
-
Setup every task and project in your PM app, Asana?
-
- Starting line: I would want to come in office to War Room around y'all's schedules and work from the office a few days in the beginning. There's always smaller things to absorb just being around that is lost in digital communication
- Slack (or whatever your team uses) for direct communication. We prioritize client communication above email, calls and texts. We keep all conversations in Slack/Teams to have transparency and a searchable knowledge base.
- Update meetings: Weekly until we find a rhythm and go biweekly. I keep them 30 minutes and apply the EOS system to keep it efficient.
-
- Will need to learn your automation processes to streamline any redundant tasks
Possible add-ons services and costs
Online Ad/PPC ad spend without markup
Video Content Production
Purchasing Email Lists via Data Broker
Programmatic Direct Messaging
Approach
Strategy-first approach: work big to small. Macro to Micro. The biggest gaffe in the outsourced marketing services sector is focusing on tactics to begin. Our approach is the following 6 phases:
1. Define Objectives, S.M.A.R.T. goals and Current Analysis & Resource Audit (a current strategy review, branding assessment, resource audit and marketing performance report).
2. Thorough research.
3. Develop a leveraging integrated, omnichannel strategy in lock step communication and approval with the client.
4. Project management execution with respect to achieving KPIs, budgets and resources
5. Analyze quantitative and qualitative reporting.
6. Continuously improve

Strategic plans without execution = a fun idea.
Discipline is the ultimate freedom.
Over-communicate until you have concise shorthand.
Time is a commodity.
Think 3 steps ahead. Contingency plan IFTTT scenarios.
Be agile & adaptable.
The obstacle is the way.
Work short-term and long term at the same time.
Analyze the past while proactively, continuously improve your present and future.
Execute omnichannel, integrated marketing campaigns, online and off.
Work macro and micro.
Generalize and specialize.
Strategic and tactical.
A/B test.
ROI should be the client's main focus and many drill down minutiae. ROI (Return On Investment) is the only thing that matters to our clients (and us). It is the cover image on every one of our proposal decks. It is our mantra; our North Star philosophy. We must provide multiple X ROI for our clients or we cease to exist.